Pollinator Survey and Data Dashboard
by Eric Gonzalez-Payne
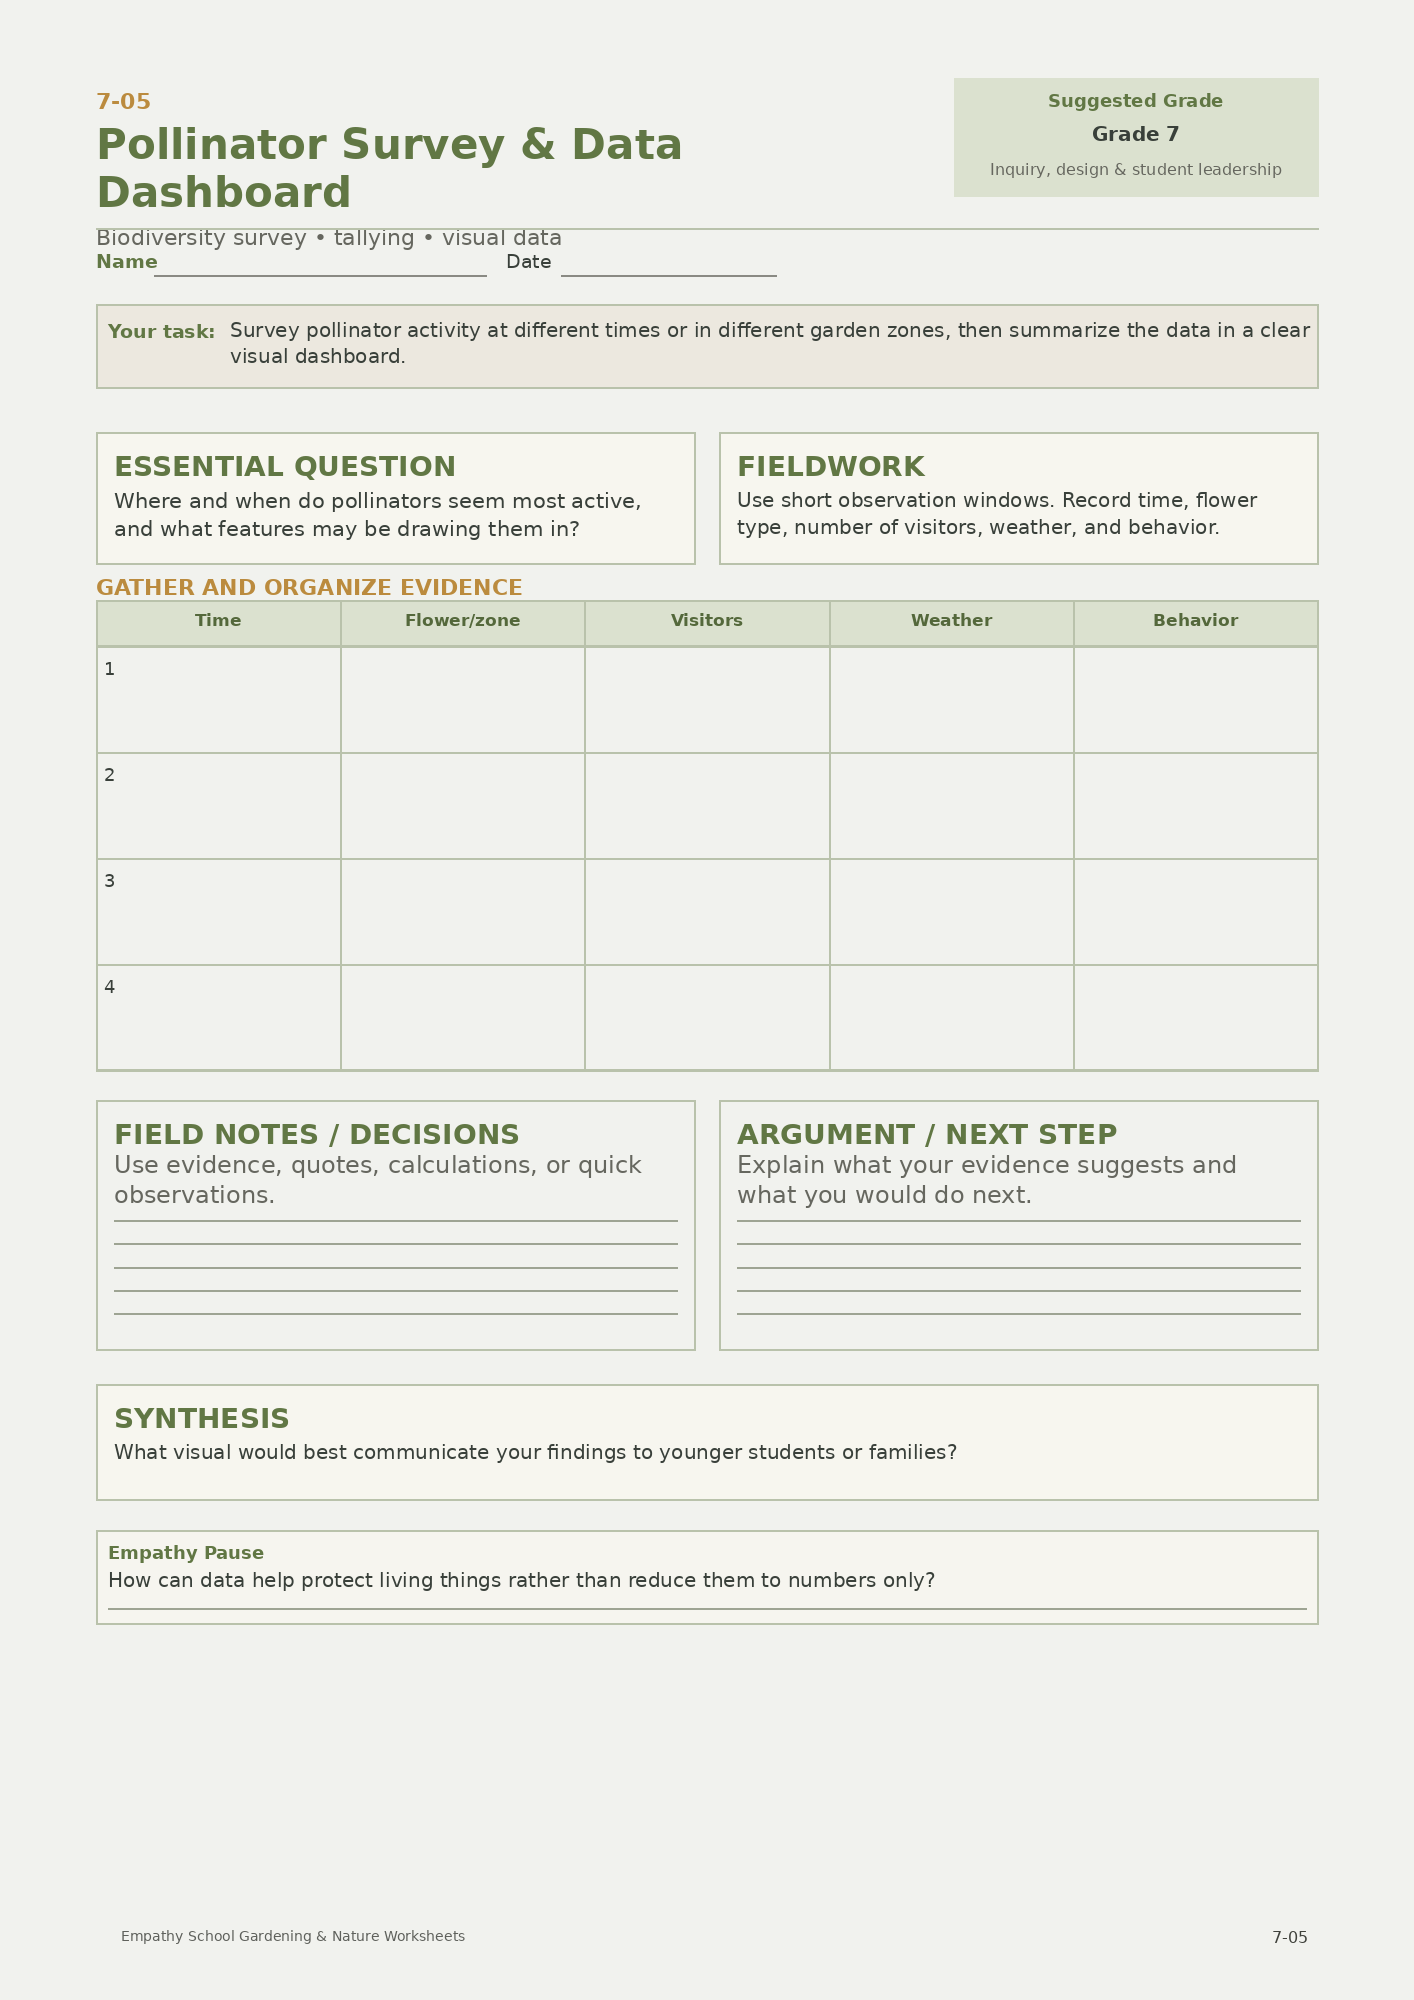
Standardised ten minute counts, repeated across weeks, times of day and plant species, then presented as a dashboard.
The dashboard is the new skill. Multiple related charts on one page, designed so a reader who was not there can understand the finding in thirty seconds.
The page has the survey protocol, the recording sheets, and a dashboard design guide. It also insists on a headline finding written in one sentence, which is harder than the charts and is the thing that turns a data set into a result.
Eric Gonzalez-Payne
Founder and curriculum author
Ed.M. in Educational Leadership, Harvard Graduate School of Education
Published by Empathy Global LLC
LinkedIn
For the full social and emotional learning programme, see the Empathy Curriculum at empathy.kids.