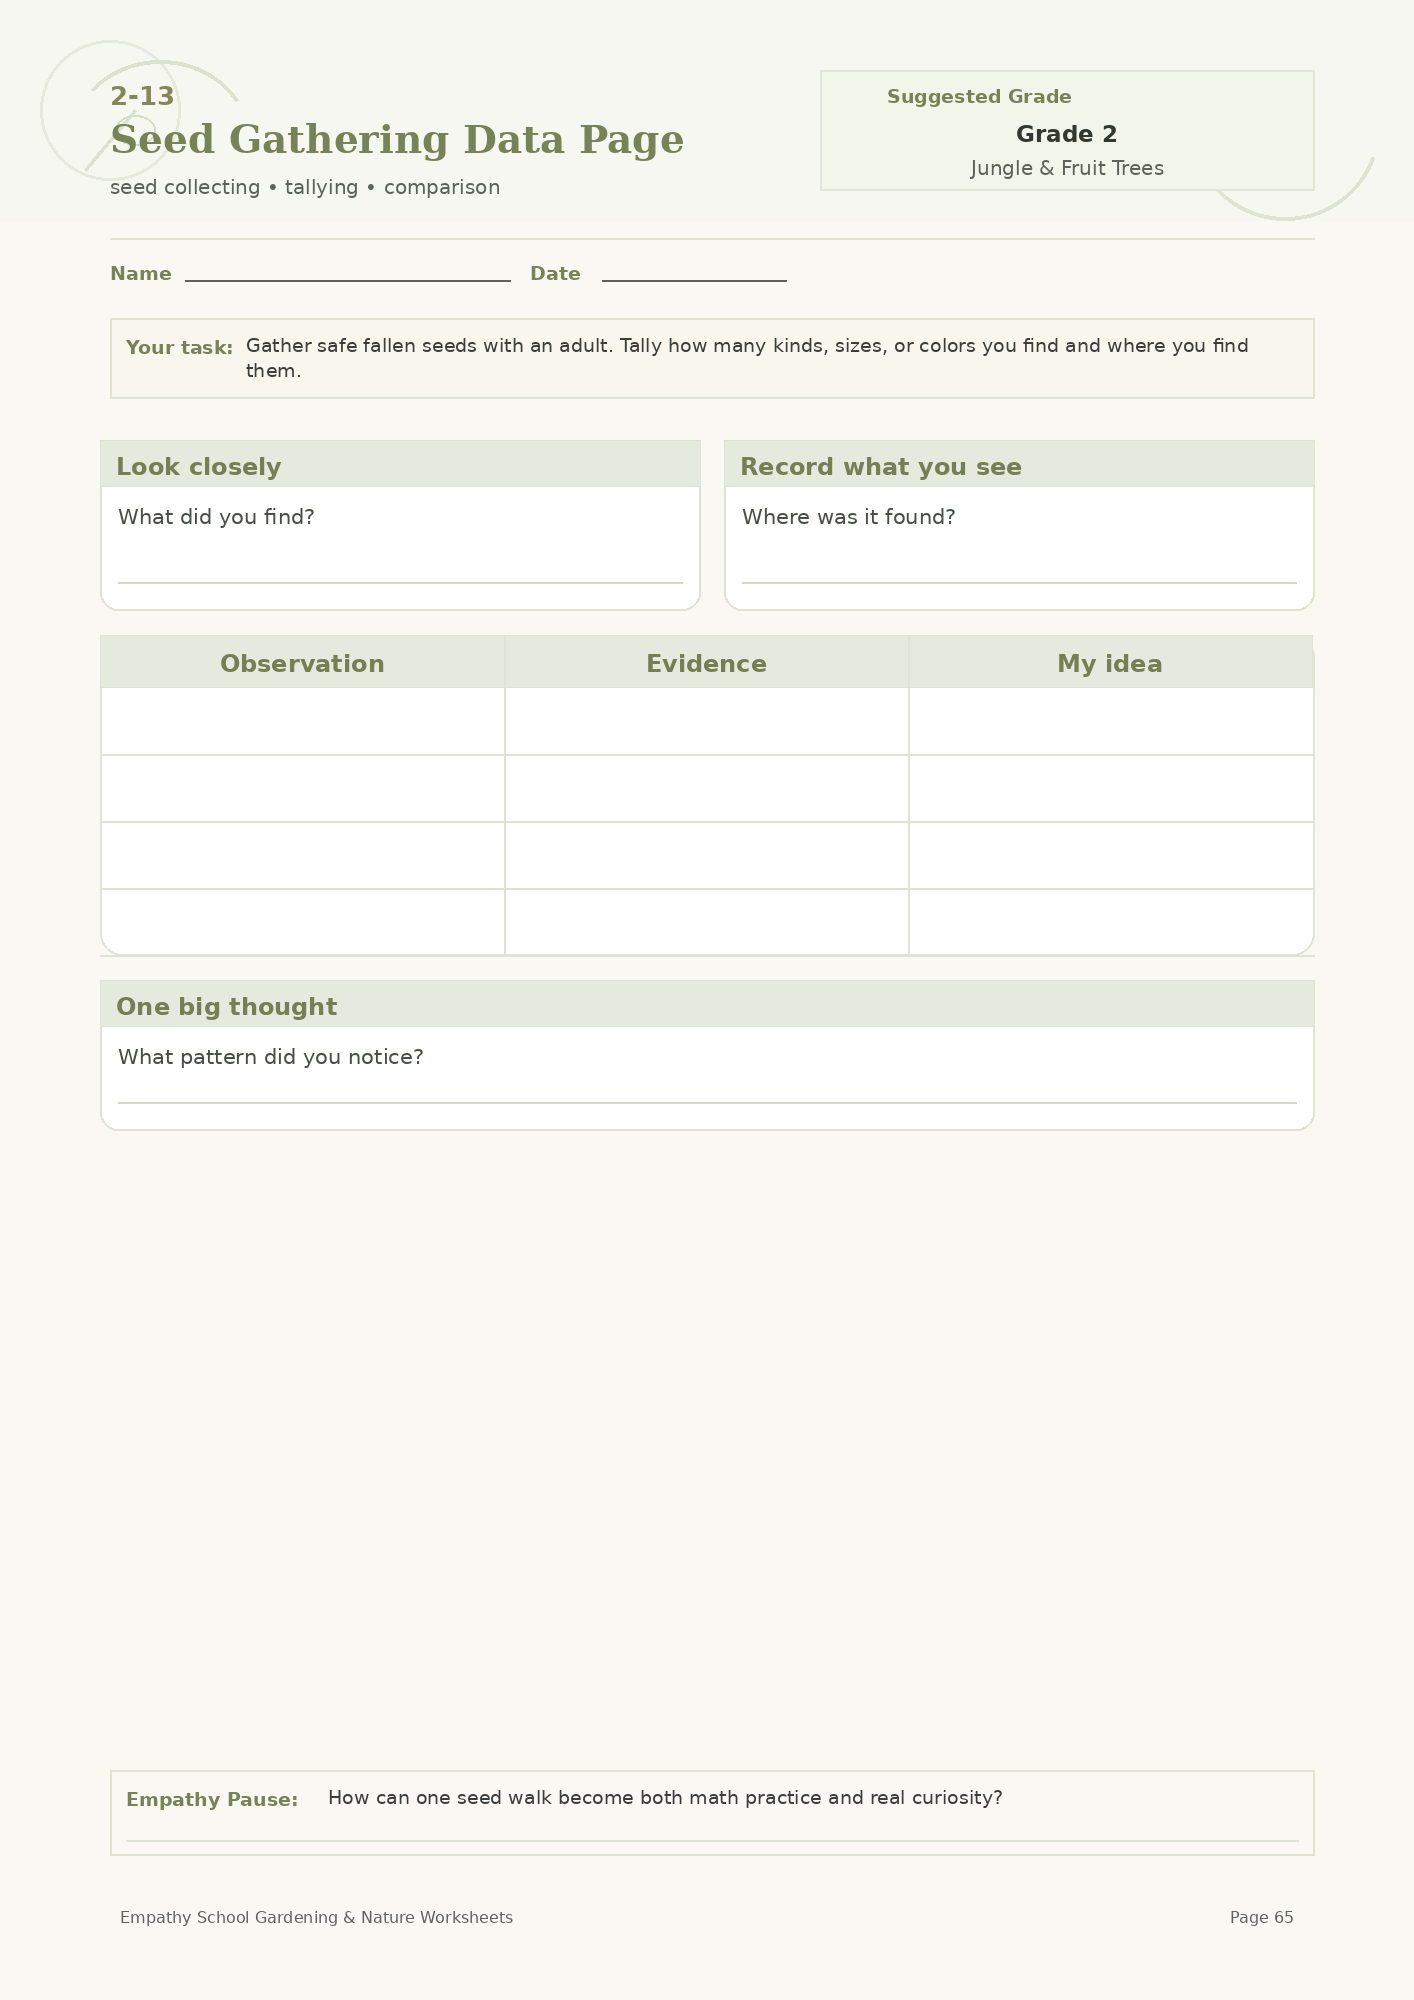
The tallies exist. Now make them a picture.
A bar chart at seven is standard content. Doing it with data the child collected themselves changes what the chart means. They know which week was windy and they can see it in the bar, which is the whole reason anyone makes charts.
The page has the chart grid, axis labels partly filled, and three questions to answer from the chart rather than from memory. That last part matters. Reading an answer off your own graph is a different skill from remembering it, and children will try to remember unless you stop them.
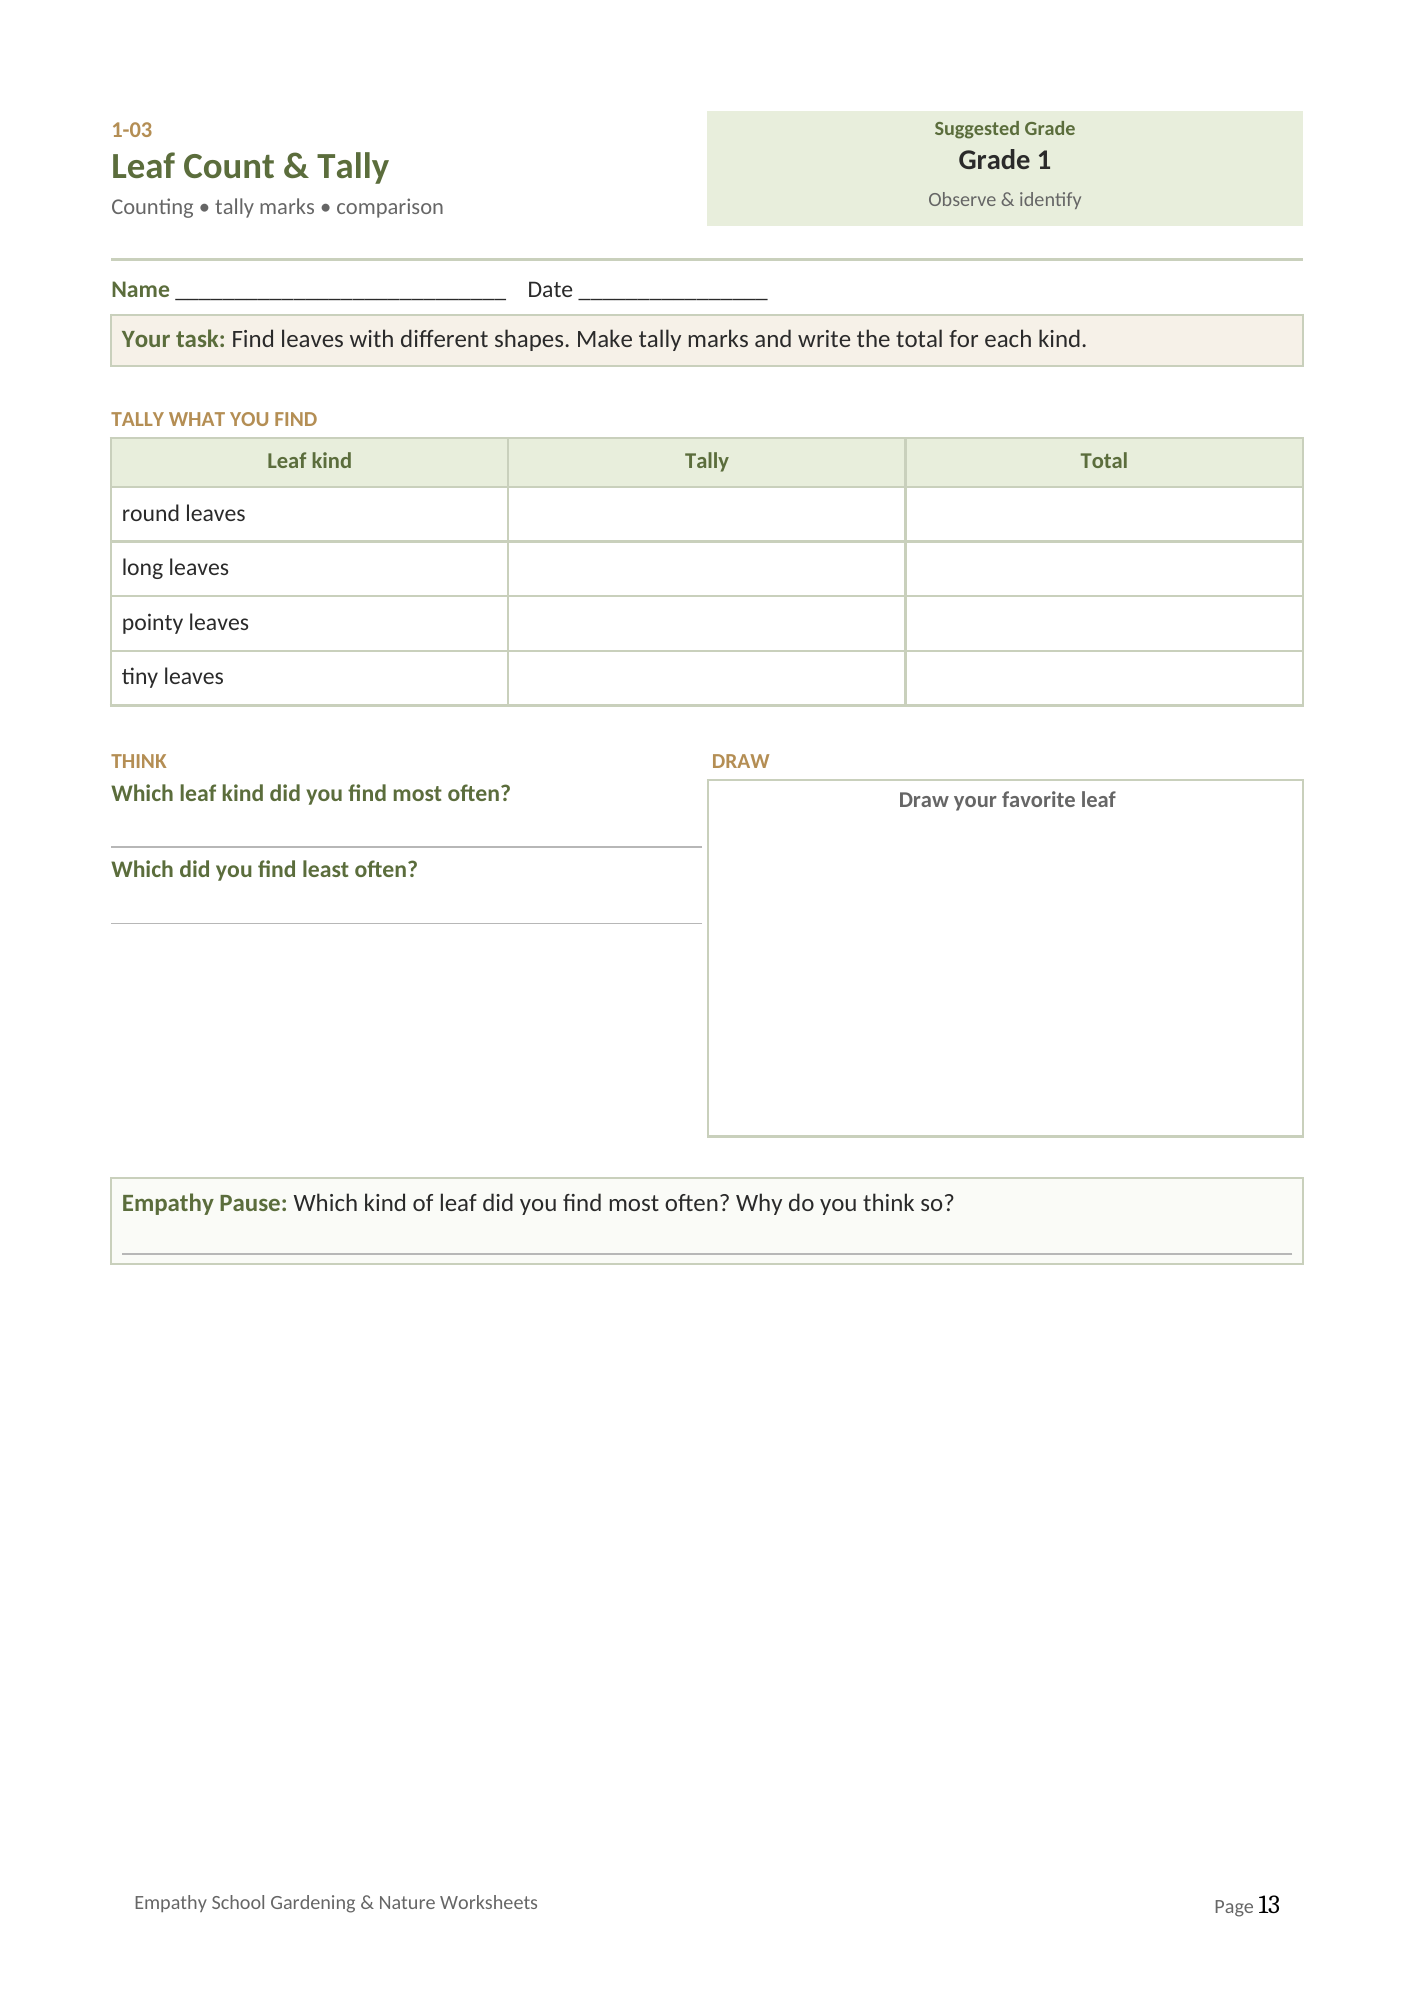
Works best after the grade one tally trail sheet has been run for a term.
Eric Gonzalez-Payne
Founder and curriculum author
Ed.M. in Educational Leadership, Harvard Graduate School of Education
Published by Empathy Global LLC
LinkedIn
For the full social and emotional learning programme, see the Empathy Curriculum at empathy.kids.